Original travel research, by the numbers
Reports built from named, dated datasets: a daily reading of what ChatGPT tells travel buyers, a quarterly report on the companies it names, a running monitor of where AI answers cite this site, 62 million search impressions, seven-country trend exports and verified third-party research. Every figure carries its source and its date. If a number appears here, you can trace it.
How this series works: three kinds of sources, always identified in the report. First-party data (our daily ChatGPT reading, our citation monitor, built from the AI Performance report in Bing Webmaster Tools, and our grounding-query logs). Large public datasets (Google Trends co-search exports, Bing keyword impressions), stamped with their capture date. And named third-party research (Pew Research Center, Fractl × Search Engine Land, Google’s AI Mode disclosures, Alphabet SEC filings, and the published reports of UN Tourism, the OECD, Eurostat, Deloitte, Mastercard, American Express, Tripadvisor and McKinsey). Where a dataset has a blind spot, the report says so in the copy.
What is measured: ChatGPT, read directly every day, and Microsoft Copilot and its partners, read through Bing’s report. Gemini and Google’s AI results are not measured.
The quarterly ChatGPT report
Who ChatGPT names, one industry per editionWhat ChatGPT tells safari buyers: Q3 2026
A traveller planning a safari now asks ChatGPT which company to book with and gets a handful of names. This report records which names, how often, and from whose pages.
On 6 October 2026, across 687 answers, ChatGPT named Wilderness in 217 of 671, ahead of andBeyond (183 of 667) and Singita (143 of 675). Four companies took 37% of all namings. Micato Safaris was picked first in 30 of the 85 answers that named it, the highest rate among the most named companies.
The full report lists all 76 companies named, by stage of the buyer’s search, with ChatGPT’s first choice on 34 core questions and every website it cited. No company pays to be in a report, and none can pay to be left out.
Read the Q3 2026 safari report
An eSIM edition is next. The counts show presence in ChatGPT’s answers, not the quality of a company. They are separate from the editorial Luxury Safari Operator Index, which is scored on published evidence.
The daily ChatGPT reading
Three industries, read every dayChatGPT cited this site in 335 of 1,980 answers on 6 October 2026
Bing’s report covers Copilot and its partners, not ChatGPT, so ChatGPT is read separately. A fixed list of about 2,000 buyer questions on safari, luxury tour operators and eSIM is asked every day, from the United States, with web search on. Every company named and every website cited is recorded, and the wording of a question never changes.
On the first day, 6 October 2026, pages on this site were cited in 172 of 687 safari answers, 119 of 659 luxury tour operator answers and 44 of 634 eSIM answers. On the core questions it was the most cited website for safari and for luxury tour operators.
The weak spots are in the same record. On general questions, before a buyer asks for a company, the site was cited in 6 of 337 answers. On eSIM core questions it was third, behind airalo.com and holafly.com.
Two earlier readings used smaller sets. From 23 to 28 September 2026, on 50 luxury safari questions asked once a day, this site made up 10.5% of all sources cited across 300 answers, ahead of africansafarimag.com (4.8%) and safaribookings.com (4.6%). On 6 September 2026, on 40 safari-buying questions, it was cited in 8 of 40 answers.
The reading describes these questions, not everything ChatGPT is asked. One day is one answer per question, and ChatGPT’s answers vary from run to run. Answers are read by software.
The citation monitor
Where Copilot and its partners cite this siteHow often AI answers cite a travel publisher
Every page on this site that is cited in AI answers on Microsoft Copilot and its partners is logged in Bing’s AI Performance report. In the ninety days from 2 July to 29 September 2026 the dashboard counted 418.1K citations. The daily figure reached 15.2K on 29 September, across 291 pages, against an average of about 4,600 a day over the ninety days.
The page-level export, which runs to 28 September, lists 478 pages cited, grouped here into 28 content clusters. Six clusters carry most of the citations: destination rankings (87,575), flight compensation and EU261 (48,769), travel credit cards (47,460), airlines and cabins (43,849), safari and expeditions (32,137) and activity booking platforms (30,310).
Volume is one measure and share is the other. On tour operator questions, pages on this site made up 37% of every source cited; on flight compensation 35%, and on airlines and premium cabins 32%.
The export runs a day behind the dashboard and reads a little lower, so the cluster counts add up to less than the dashboard total. Bing describes its AI Performance data as a sample of overall activity. The next reading comes with the next export. For the questions the assistants ask when they cite the site, see What travellers ask AI.
Don’t just measure how AI sees you. Change it.
- For travel companies. The same record that fills these reports shows one company where it stands in ChatGPT and Copilot today.
- What you see. Where you are named and where a competitor is named in your place, the words used about you, and the pages behind the answer.
- What happens next. A plan against your goals, changes on our pages and yours, and the same questions asked again to show what moved.
- What it does not cover. Gemini and Google’s AI results.
The machine layer
How AI changed travel discovery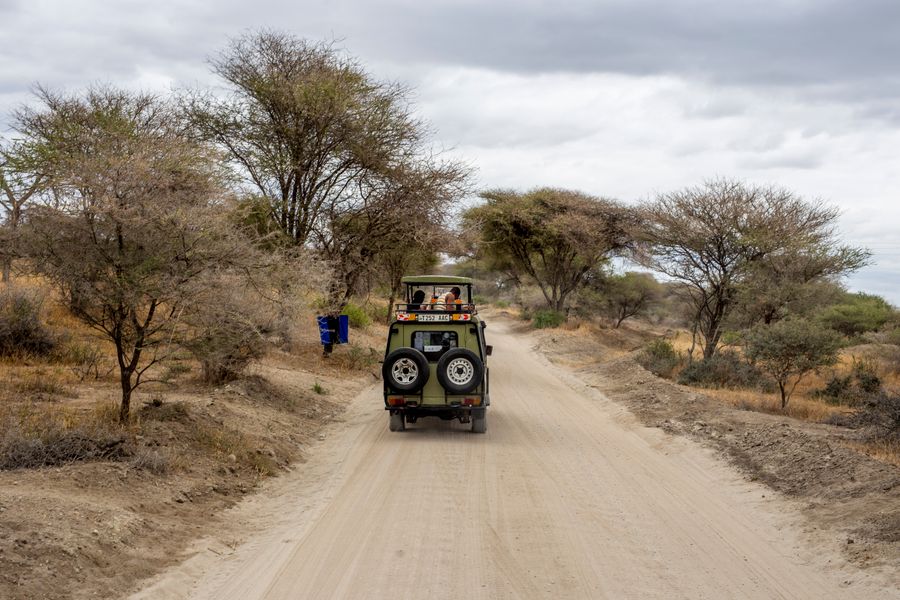
What travellers ask AI: 17,600 questions analysed
Our own citation logs, opened: 576 grounding queries, flight compensation and safaris taking half the pie, and barely 1% phrased like a human.
July 2026

AI vs the click: travel search by the verified numbers
68% of US searches now end without a click; the Fractl million-keyword study shows demand redistributing, not shrinking: travel is the resilient vertical.
July 2026
The state of play
The industry, in sourced numbers
The state of travel 2026: 40 numbers that explain the year
307 million Q1 arrivals, a record 847 million across the OECD, $1.37 trillion in US spend, and the great bifurcation: fewer travellers, spending more each.
July 2026

What luxury travellers want in 2026: the behaviour shift in 30 statistics
Pet bookings up 260%, luxury rail the most-wanted stay, milestone trips filling calendars, and wellness compounding towards $2.1 trillion.
July 2026
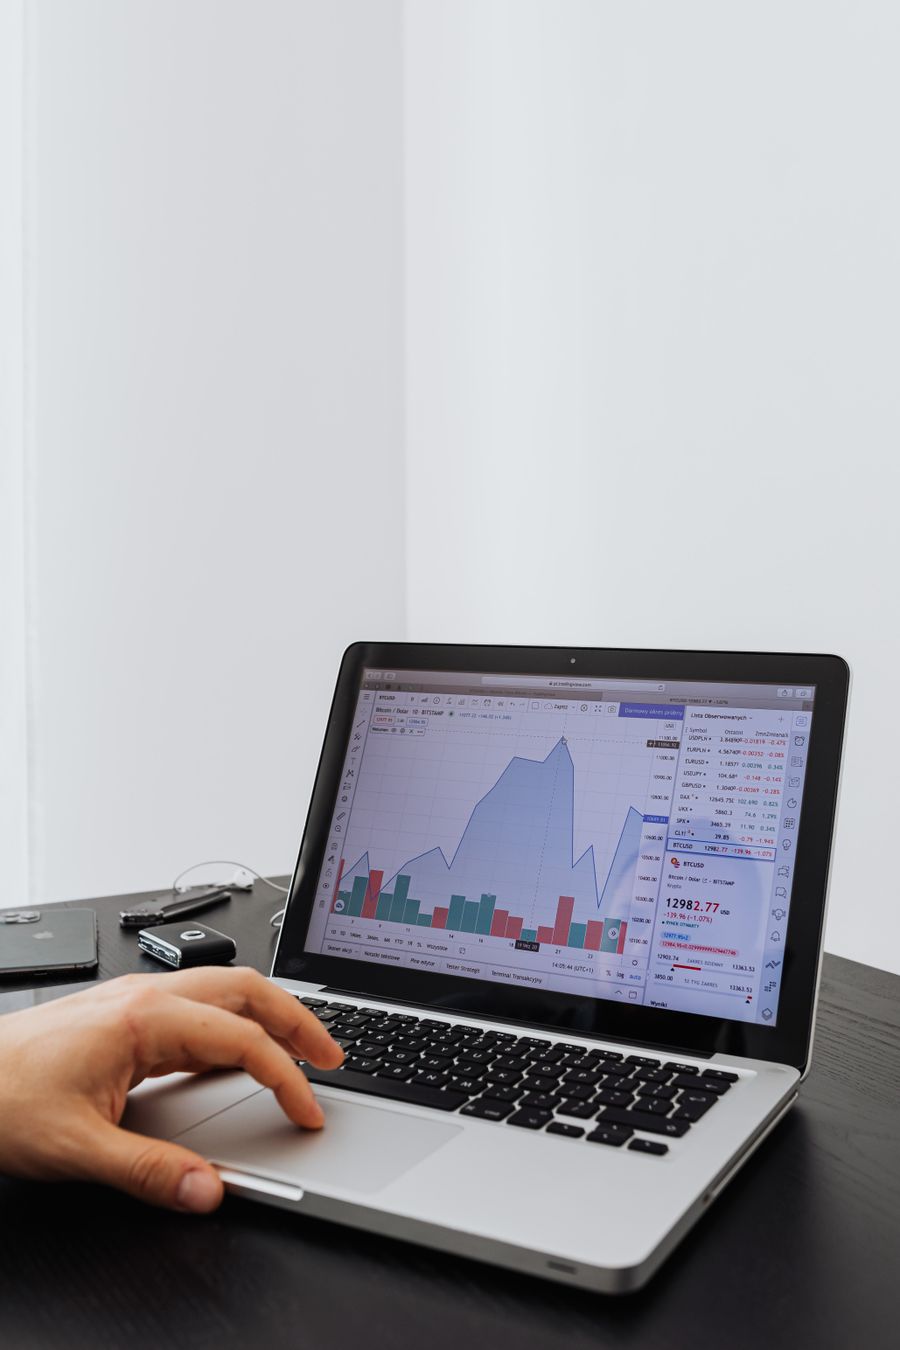
The price of a click: what advertisers pay for luxury travel searchers
Advertising’s honest metric: arranger clicks cost roughly three times product clicks, and “luxury travel company” now out-searches “luxury travel” itself.
July 2026
The demand ledger
Where the world wants to go
The most-searched travel destinations of 2026
34 cities ranked by 44,089,019 search impressions. Osaka leads, Japan takes four of the top eight, and 22 European cities finish within 8% of each other.
July 2026

The Travel Demand Index 2026
What 62 million search impressions reveal: the Japan surge, the solo-travel spike, and the budget-and-luxury split-screen consumer.
July 2026

The luxury travel search map 2026
Luxury co-search trends across seven markets: agents declining everywhere, companies rising, and India up 300% in British searches.
July 2026
The category reports
One market, measured, per report
The travel insurance search report
The grey boom: over-70s cover up 1,400%, US comparison searches up 450%, and Britain’s comparison sites losing the comparison.
July 2026
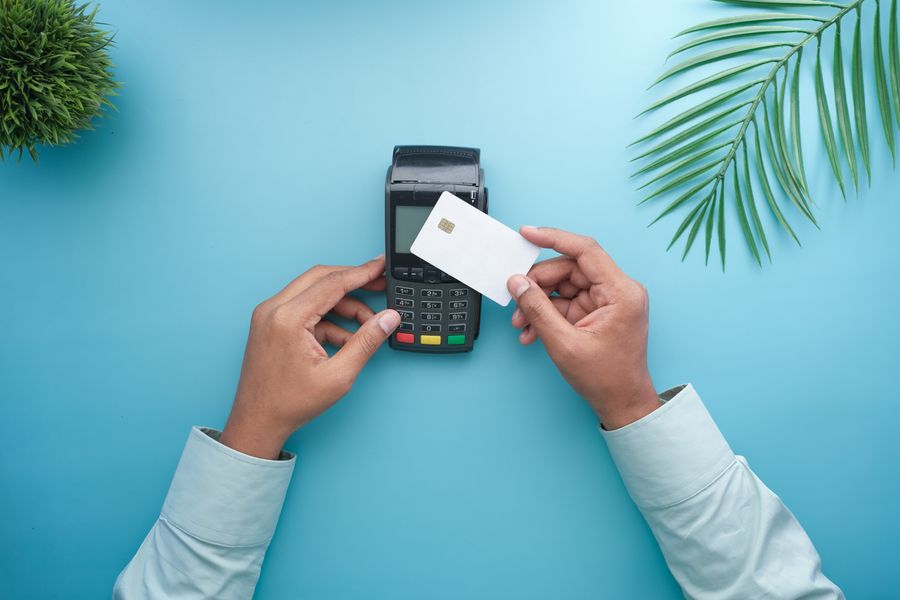
The travel credit card search report
Amex research attention down 80%, “best credit cards 2026” breaking out, and a market splitting into premium rewards and credit repair.
July 2026
eSIM search trends 2026
The education boom in one dataset: “what is esim” up 90%, challenger brands breaking out, and one provider alone in the US head terms.
July 2026
Citing this research
Journalists, researchers and publishers are welcome to quote or reproduce any figure from an Uncompromised Data report with attribution to Uncompromised Travel and a link to the report it comes from. The quarterly ChatGPT report, the daily reading and the citation monitor are published here first and exist nowhere else.
For methodology questions or the numbers behind any chart, write to richard@uncompromised.travel. Companies that want to know where they stand in these answers can start on the For Brands page. The full editorial archive lives under Travel Intelligence.