The Most-Searched Travel Destinations of 2026: 34 Cities, Ranked by 44 Million Searches

Ask the search box where the world wants to go and it answers precisely. This league table ranks all 34 cities in the "travel to" cluster of our Bing keyword dataset — 44,089,019 search impressions, 71% of a 62-million-impression travel sample, captured 5 July 2026. The result is not the ranking the brochures would predict: Osaka beats every marquee capital, Japan takes four of the top eight, Thailand’s beach cities out-search Shanghai — and twenty-two European cities finish in a photo so tight that 65,000 impressions separate 13th from 34th.
Half this table is Asia at long-haul distance. Charter turns a two-stop itinerary into a schedule you set yourself.
Compare private charter quotes →How the Ranking Works
One measure, applied evenly: Bing search impressions for each city’s "travel to" query, from a 146-keyword, 61,955,752-impression travel dataset pulled on 5 July 2026. Impressions count how often searchers generated the query — raw, unweighted intent. No editorial thumb on the scale, no tourism-board arrivals figures, no social-media sentiment: this is what people actually typed when they were thinking about going somewhere. The macro story of the same dataset — category trends, spikes, and the solo-travel surge — is in our Travel Demand Index; this page is the city-level ledger.
The Top Twelve, Profiled
1. Osaka — 3,005,649. The most-searched destination on Earth in this dataset, more than half a million impressions clear of second. Kansai’s kitchen has become the entry point for the entire Japan boom — and the boom is broad, as the next three Japanese entries prove. Timing the trip is its own science: our cherry blossom timing guide covers the season everyone searches for.
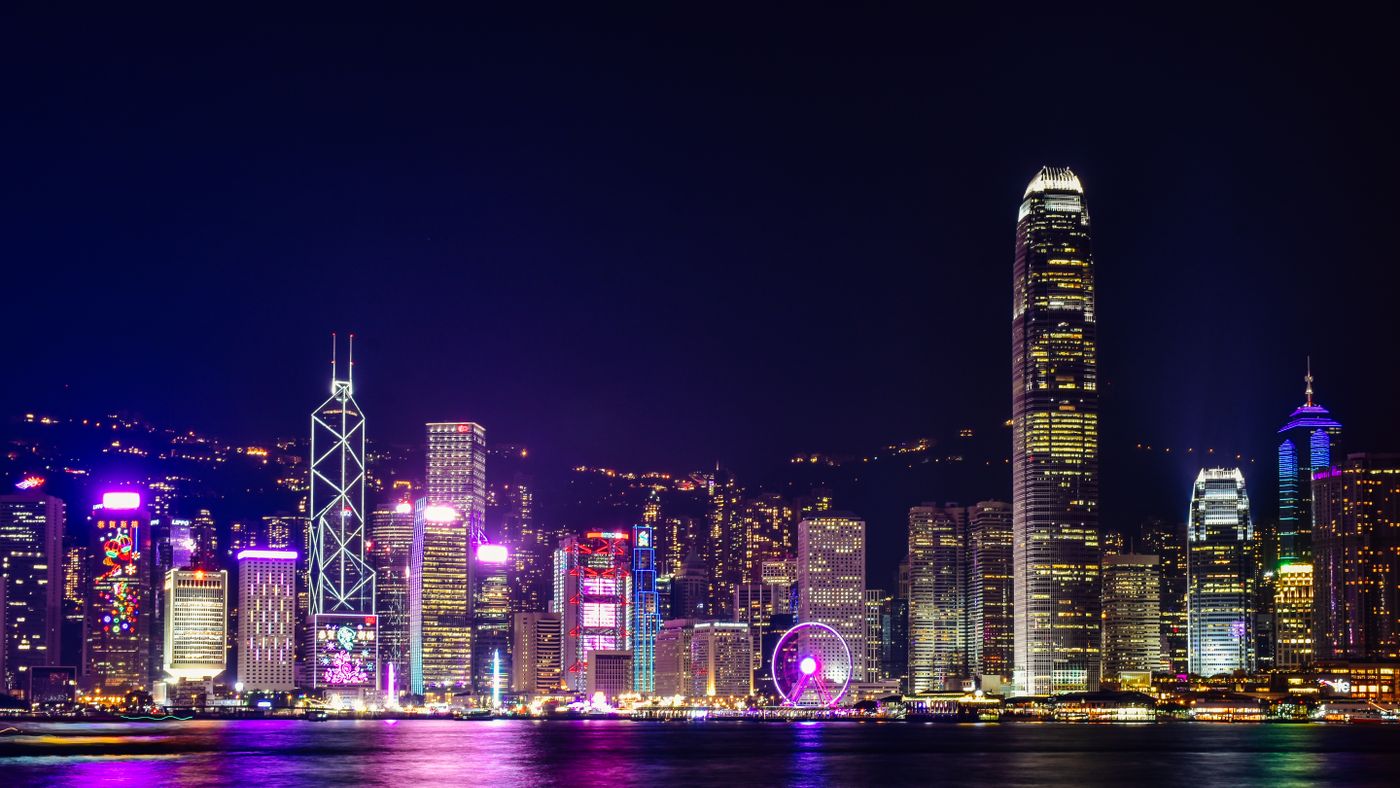
2. Hong Kong — 2,495,269. The great re-entry. After years out of the itinerary conversation, Victoria Harbour is back within 12,000 impressions of Kyoto and comfortably ahead of Shanghai — the strongest single signal of Asian city-break recovery in the table.
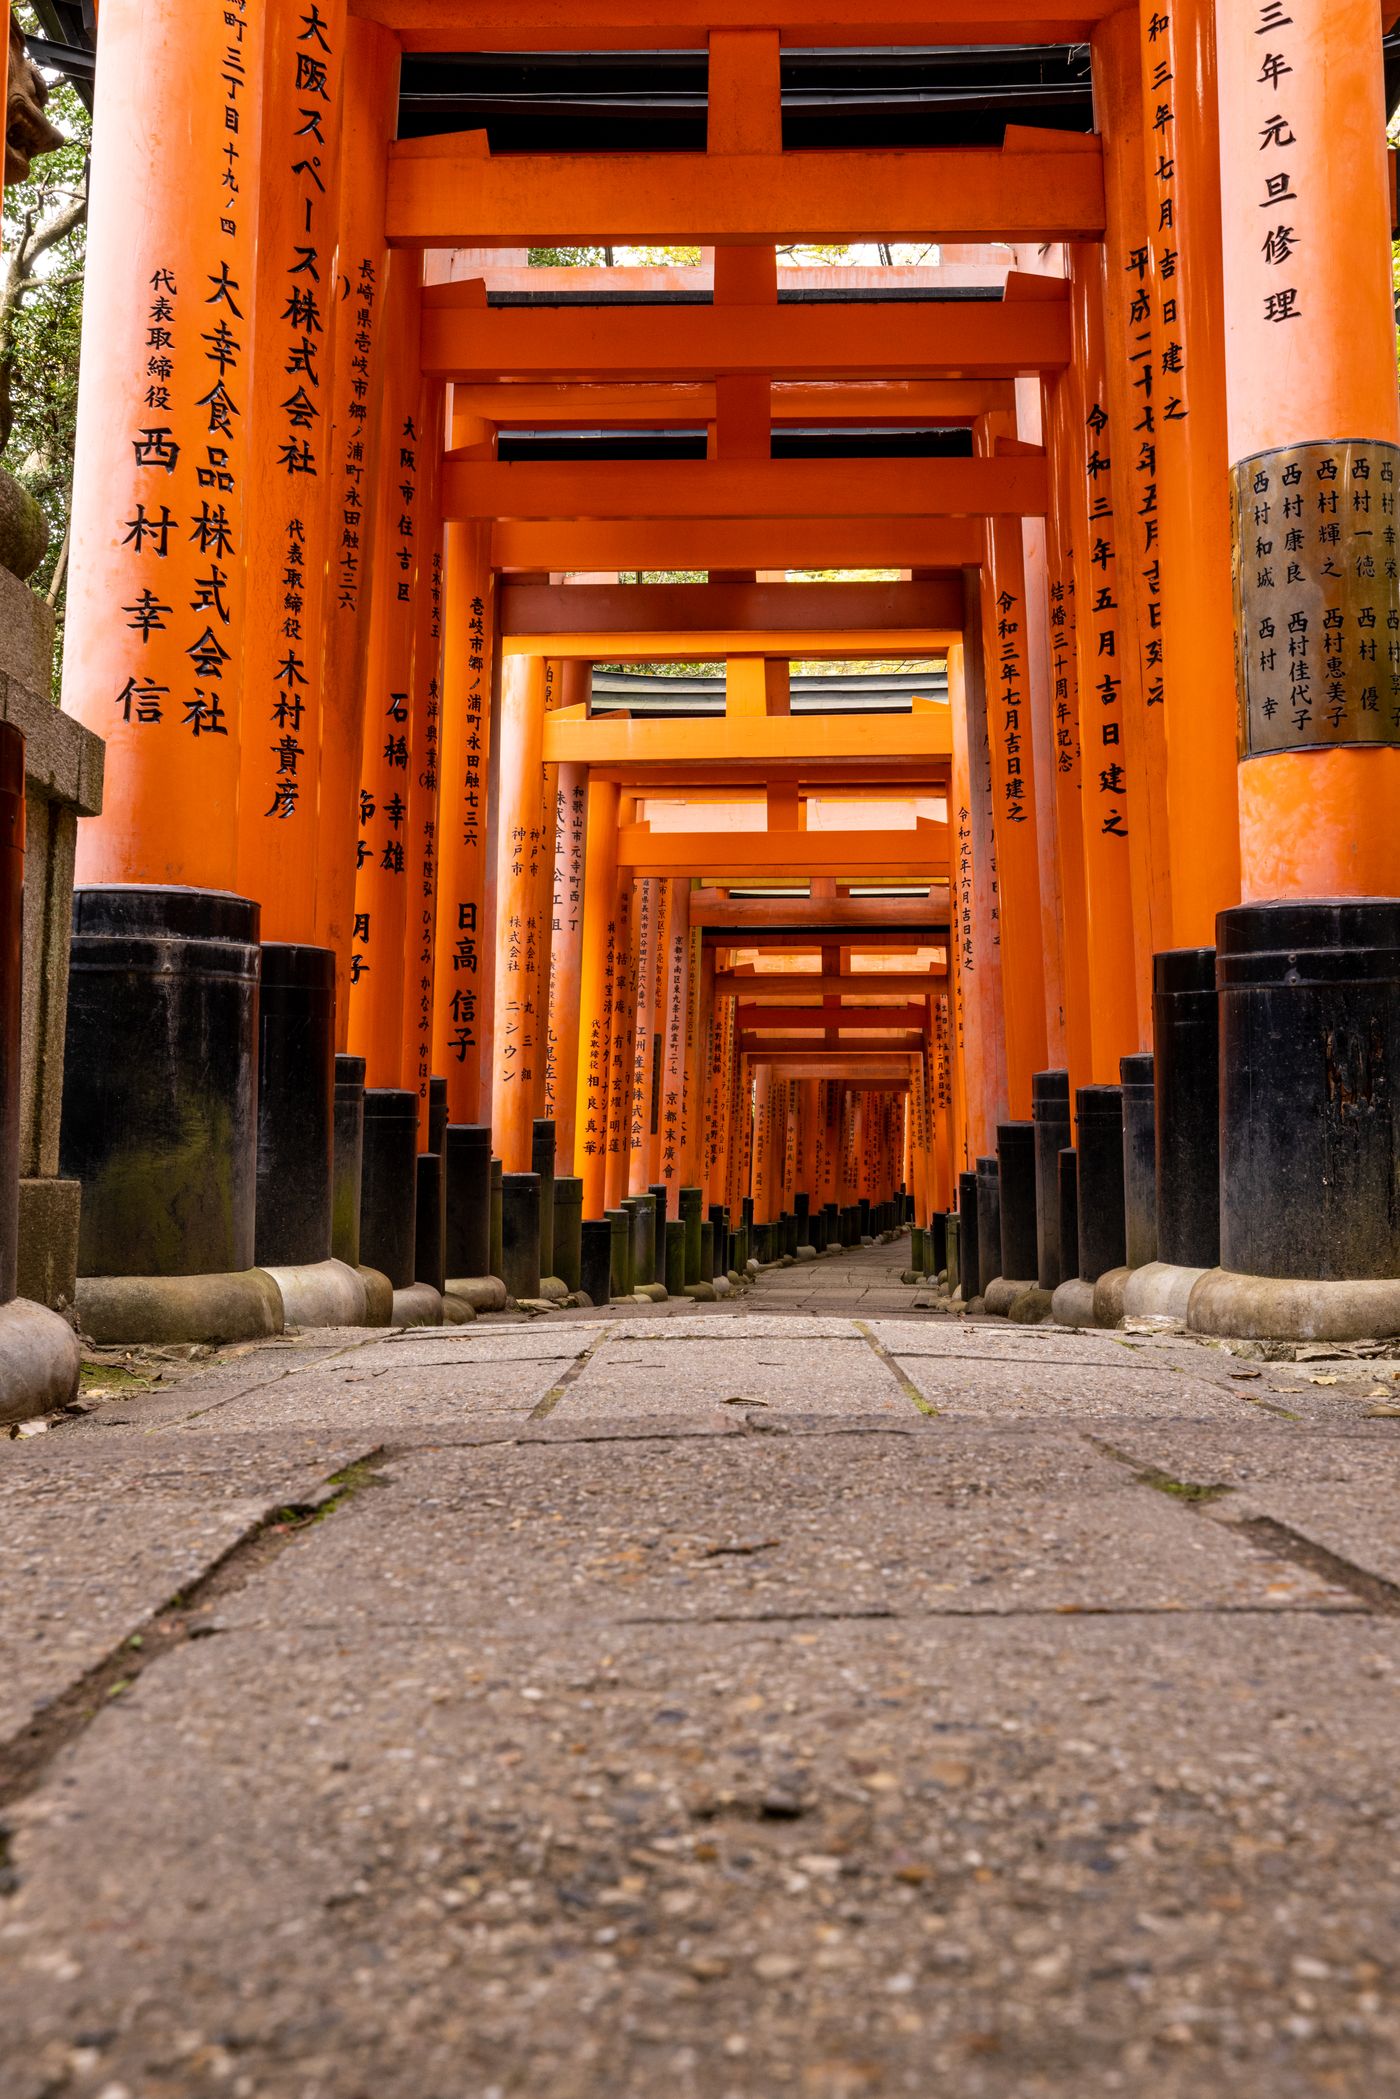
3. Kyoto — 2,485,586. The classic, three places behind its brasher neighbour and separated from Fukuoka by barely 11,000 impressions. That Japan’s ancient capital ranks third and it still reads like an upset says everything about how deep the country’s demand runs.
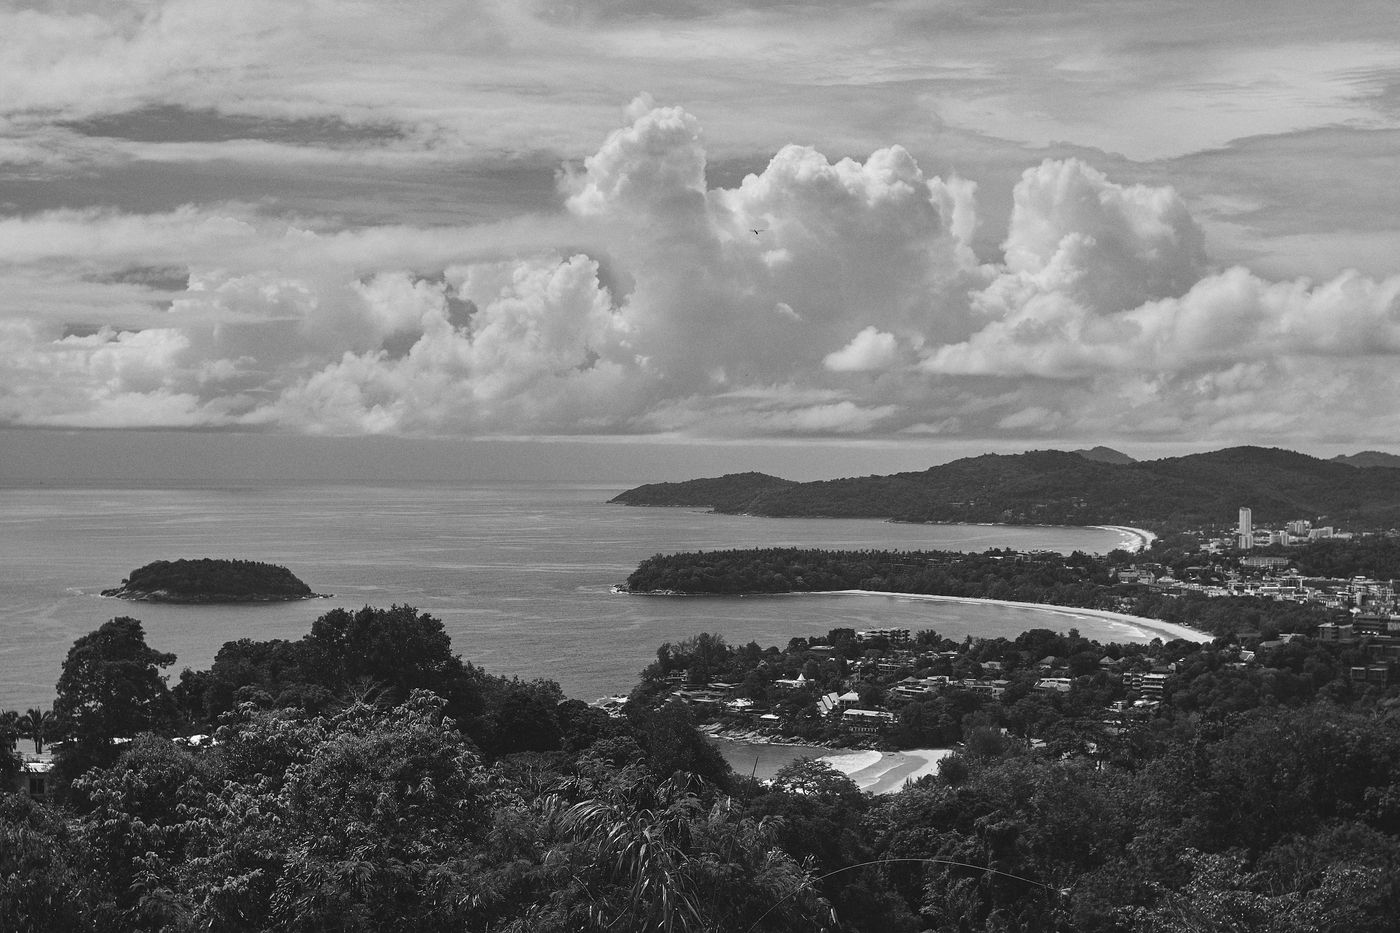
4. Fukuoka — 2,474,276. The sleeper of the entire table. A city with a fraction of Kyoto’s international profile sits 11,310 impressions behind it — evidence that searchers have moved past the golden-route triangle into regional Japan. 5. Phuket — 2,424,369 and 6. Pattaya — 2,394,981 make Thailand the only country with two entries in the top six, a combined 4.82 million impressions for the beach corridor; our Phuket guide and Thailand luxury guide cover the ground, and the month-by-month timing answer is the question behind half these searches.
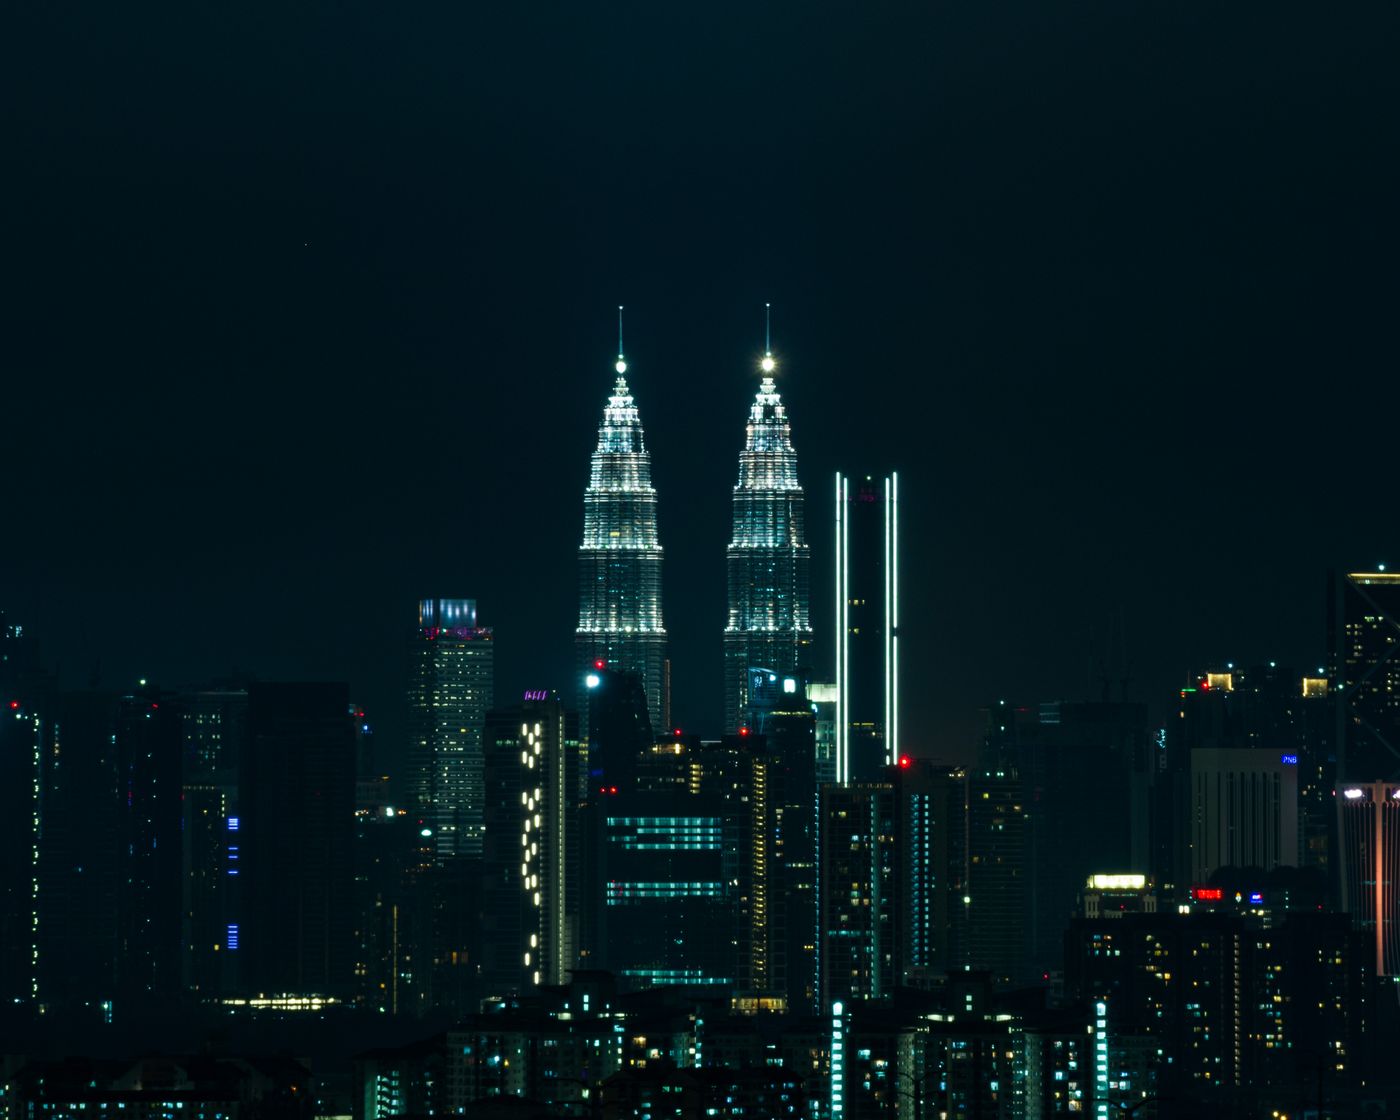
7. Kuala Lumpur — 2,373,035. The quiet giant: barely marketed to Western audiences relative to Bangkok or Singapore, yet out-searching Shanghai by more than half a million. 8. Sapporo — 2,351,527 closes Japan’s quartet — four cities, 10,317,038 impressions, more than the bottom thirteen European cities combined. The case for the region’s dominance is argued in full in why Asia owns luxury travel in 2026.
9. Shanghai — 1,797,803 leads a mid-table of one — a 550,000-impression gap to KL above and 240,000 to Munich below. 10. Munich — 1,556,649 is Europe’s best performer, ahead of every capital on the continent. 11. Oslo — 1,462,273 and 12. Florence — 1,445,790 complete the tier where individual cities still separate from the pack; below this line, Europe compresses into a plateau.

The Full 34-City League Table
| Rank | City | Country/Region | Impressions |
|---|---|---|---|
| 1 | Osaka | Japan | 3,005,649 |
| 2 | Hong Kong | Hong Kong SAR | 2,495,269 |
| 3 | Kyoto | Japan | 2,485,586 |
| 4 | Fukuoka | Japan | 2,474,276 |
| 5 | Phuket | Thailand | 2,424,369 |
| 6 | Pattaya | Thailand | 2,394,981 |
| 7 | Kuala Lumpur | Malaysia | 2,373,035 |
| 8 | Sapporo | Japan | 2,351,527 |
| 9 | Shanghai | China | 1,797,803 |
| 10 | Munich | Germany | 1,556,649 |
| 11 | Oslo | Norway | 1,462,273 |
| 12 | Florence | Italy | 1,445,790 |
| 13 | Dublin | Ireland | 848,416 |
| 14 | Edinburgh | United Kingdom | 841,167 |
| 15 | Warsaw | Poland | 835,792 |
| 16 | Thessaloniki | Greece | 825,868 |
| 17 | Budapest | Hungary | 825,750 |
| 18 | Porto | Portugal | 824,456 |
| 19 | Tbilisi | Georgia | 823,001 |
| 20 | Tallinn | Estonia | 820,520 |
| 21 | Nice | France | 815,172 |
| 22 | Vienna | Austria | 812,105 |
| 23 | Berlin | Germany | 810,643 |
| 24 | Bologna | Italy | 809,704 |
| 25 | Heraklion | Greece | 807,115 |
| 26 | Verona | Italy | 800,963 |
| 27 | Rhodes | Greece | 796,830 |
| 28 | Seville | Spain | 795,239 |
| 29 | Milan | Italy | 793,863 |
| 30 | Zurich | Switzerland | 792,519 |
| 31 | Palma de Mallorca | Spain | 788,443 |
| 32 | Stockholm | Sweden | 785,956 |
| 33 | Venice | Italy | 785,380 |
| 34 | Copenhagen | Denmark | 782,910 |
Read the bottom twenty-two rows closely: from Dublin at 848,416 to Copenhagen at 782,910, twenty-two European cities land inside a 65,506-impression band — a spread of under 8%. Porto (824,456, 18th) sits mid-pack of the plateau while out-searching Milan, Vienna, and Venice; the case for choosing it is made in why Porto, not Lisbon. On-the-ground plans for any city here start with skip-the-line inventory — GetYourGuide covers all 34.
What the Regions Reveal
Asia is the headline. Eight of the top nine cities are Asian, worth 20.3 million impressions between them. Japan alone accounts for 10,317,038 — 23% of the entire table from four cities — and the presence of Fukuoka and Sapporo alongside Osaka and Kyoto shows demand has outgrown the first-timer route. For travellers, the practical footnote is connectivity: every Asian entry here is an eSIM market, and Airalo covers all of them from one app.
Europe is broad, not deep. Twenty-two cities, 17,821,812 combined impressions — 40% of the table — but no single European city cracks the top nine. The demand exists; it simply refuses to concentrate. The plateau is also an arbitrage: near-identical search interest across cities with wildly different peak-season prices, which rewards the multi-city itinerary — exactly the routing problem Kiwi’s multi-stop search was built for.
The absences are data too. No Paris, London, Rome, New York, Tokyo, or Bangkok — this cluster captures the "travel to" phrasing, which skews toward destinations people research as considered trips rather than default icons searched by name alone. That makes the table arguably more honest about emerging intent: it measures the trips people are talking themselves into, and in 2026 those conversations are overwhelmingly about Kansai, the Andaman coast, and a very crowded European shortlist.
Thirty-four cities, one table. The itinerary connecting them is a quote away.
Get a charter quote →